NetDiag: workstation network diagnostics
Read a workstation's verdict, find out what is to blame when the connection drops (PC, Wi-Fi, LAN, Internet, DNS, service), run a traceroute, a speed test or a packet capture.
NetDiag answers the classic support question: when the connection drops for someone, where does the problem come from? The agent measures the workstation roughly every 15 seconds and, for each measurement, points to the first link in the chain that failed.
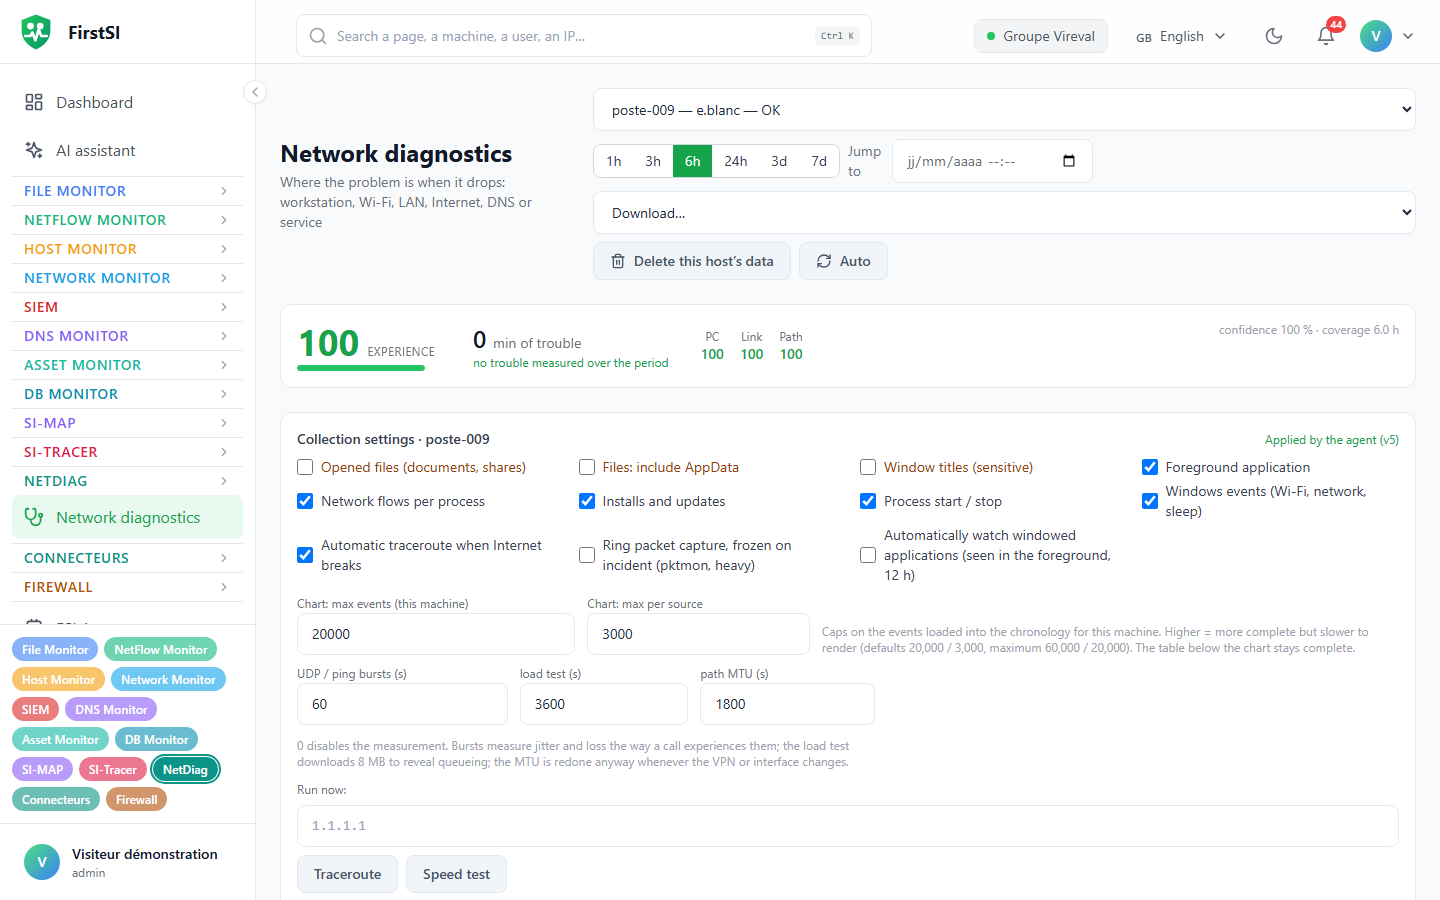
Opening a workstation
- Menu NetDiag → Network diagnostics (
#/netdiag). - In Select a workstation, type the workstation name or the person's name: the list shows the signed-in user next to each workstation.
- Pick the period. Jump to centres the timeline on a given time (± 1 h), for instance the time quoted in the ticket.
Global search (Ctrl+K) also offers the NetDiag page as soon as you type the workstation name.
Reading the verdict
The Verdict timeline colours every measurement. NetDiag works its way from the workstation towards the service and keeps the first layer that failed:
| Verdict | Label | What failed (sample thresholds) |
|---|---|---|
| PC | Workstation | Sleep, no network link, Wi-Fi disconnected or weak (quality < 30%), access point change, crashed or frozen application, CPU > 90% |
| LAN | LAN | Gateway unreachable or slow (> 100 ms) |
| INFRA | Local infra | Active Directory domain not resolved or slow (> 1,500 ms), domain controller unreachable or slow (> 100 ms) |
| WAN | Internet | Both Internet targets silent, latency > 250 ms, 30 or more TCP retransmissions per measurement |
| DNS | DNS | Resolution failing or slower than 2,000 ms |
| SERVICE | Service | Service (Teams by default) unreachable or slower than 1,500 ms, failed Teams connections, a declared probe failing |
| OK | OK | Everything answers |
Causes of anomalies lists the reasons found over the period and how often they occurred. It is often the line to paste into the ticket.
An "Internet" verdict means the site gateway answers but neither Internet target does. The workstation and the local network are therefore not to blame.
The experience score
Three scores from 0 to 100 sum up the period. PC covers the machine (CPU, memory, frozen applications, the workstation's Wi-Fi), Link the local link (Wi-Fi, access point, gateway), Path the route to the services (loss, jitter, latency added under load, MTU).
The experience score is the lowest of the three. A minute counts as a minute of trouble when the experience score drops below 70 and someone is using the workstation (keyboard or mouse). The screen also shows the minutes of trouble, the coverage (share of the period actually measured), the confidence, the worst moment and the Main cause. The why …? link explains the calculation.
Charts and timeline
| Chart | Content |
|---|---|
| Ping latency | Gateway, DNS, AD domain, Internet (ms) |
| Wi-Fi | Quality (%) and link speed, access point and channel |
| DNS resolution and service connection | Resolution time and TCP connect time (ms) |
| CPU and Teams connections | CPU, Teams TCP and UDP (media) connections |
| Throughput | Internet, LAN, network adapter, TCP retransmissions |
To zoom, draw a rectangle on a chart or use Ctrl + mouse wheel. ◀ and ▶ move the window; a double-click or Whole period goes back to the full view.
The Event timeline shows one dot per event and one row per source: Wi-Fi, network profile, sleep, DHCP, interface, TCP failures, installs, processes… Coloured bands show when the VPN was connected, the Wi-Fi quality, the UniFi access point and Teams calls (red when quality was degraded). Click a dot to see the surrounding 5 minutes in the table, which you can filter by message, file or process with the search field.
Applications
For the measurement on screen, the Applications block lists the watched applications, the one in the foreground and the heaviest ones in CPU, RAM or I/O. "not responding" flags a frozen window.
Each watched application gets its own verdict:
| Verdict | Cause |
|---|---|
| application | The application itself: crash, freeze, CPU ≥ 50%, RAM ≥ 2 GB |
| PC | The machine |
| network | The network |
| server | Its server: unreachable, failed connections, slow |
Application dependencies lists the servers it talks to. The most used destination is probed every 15 s, which tells a slow server apart from a slow workstation.
Teams
If an administrator has connected Microsoft Graph (see Settings), Teams calls appear on the timeline. A call's detail view puts side by side, minute by minute, what Teams measured and what the workstation was going through. If both degrade at the same time, the cause is local (Wi-Fi, workstation, gateway). If only Teams degrades, look towards the Internet or Microsoft.
Running an action
Under Run now:
| Action | Effect |
|---|---|
| Traceroute | To the target you enter (empty = the workstation's Internet target). The result appears on the timeline. |
| Speed test | Download and upload speed to the FirstSI server, one test per customer every 20 s. |
| Packet capture | 5 to 120 s (30 by default). The pcapng file, to open in Wireshark, appears under Packet captures. |
The agent picks up the request within 15 seconds.
A capture only keeps packet headers (128 bytes per packet, 30 MB at most), never the content of the traffic. Limits: one capture per workstation every 2 minutes, 30 per customer over 10 minutes, 2 GB per customer in total. Files are kept for 30 days.
Downloading a report
Download… prepares files for the period on screen. The diagnostic report (PDF) can be attached to the ticket as is: summary, verdict timeline, charts, workstation details, incidents, Teams calls. You can also download the events, the measurements (one row every 15 s), the Teams calls and the access point history as CSV, or everything raw as JSON.
Settings
Settings are for administrators only. Each one exists for a single workstation or as the default for the whole customer (Save default). The agent applies it within a minute, without restarting.
| Setting | Default |
|---|---|
| Foreground application, network flows per process, installs, process start/stop, Windows events | on |
| Automatic traceroute when Internet breaks | on |
| Ring packet capture, frozen on incident | off |
| Automatically watch windowed applications | off |
| Opened files, Files: include AppData, Window titles | off (sensitive options, shown in orange) |
| Applications to watch | up to 10 executables, on top of Teams and Citrix |
| Extra probes | up to 3, host:port, wildcard *.domain.com accepted |
| VPN subnets | An interface addressed inside = VPN connected; ! before a range = never a VPN |
| UDP / ping bursts, load test, MTU | 60 s, 3,600 s, 1,800 s (0 turns it off) |
For NetDiag alerts, tick Alert when a PC stays non-OK and set the delay (5 minutes by default, 1 to 120), up to 5 e-mail addresses and a Teams or Slack webhook. A back-to-normal message follows.
Teams call quality is set up in the NetDiag · Teams tab of the settings. You need an Entra app registration with the CallRecords.Read.All application permission (plus User.Read.All to look people up) and admin consent. You then declare up to 5 Teams users per workstation; calls that cannot be tied to a monitored workstation are not kept.
Data and deletion
Measurements, events and calls follow the customer's retention period (Data, GDPR and audit). Delete this host's data (administrators) erases everything collected for that workstation, with no way back.
Frequently asked questions
The workstation list is empty. No agent has the NetDiag module. Turn it on in FSI Agents → Configure, or install the agent with NETDIAG=true.
Does NetDiag read my file names? No, unless an administrator turns on the Opened files option.
"Workstation" verdict for someone working from home. That is expected: from NetDiag's point of view, the home Wi-Fi is part of the workstation. Check Wi-Fi quality and the access point in the charts.
Why "Local infra"? The workstation cannot reach the Active Directory domain (internal DNS or domain controller) even though the gateway answers. Most of the time the VPN is not up.
Source: · FirstSI Docs · updated 2026-10-10