Alerts and notifications
Where each module's alerts end up, how to handle them, and how to get notified by e-mail, Teams or Slack.
Each module detects its own anomalies and files them in its own screen. Use the table below as a map.
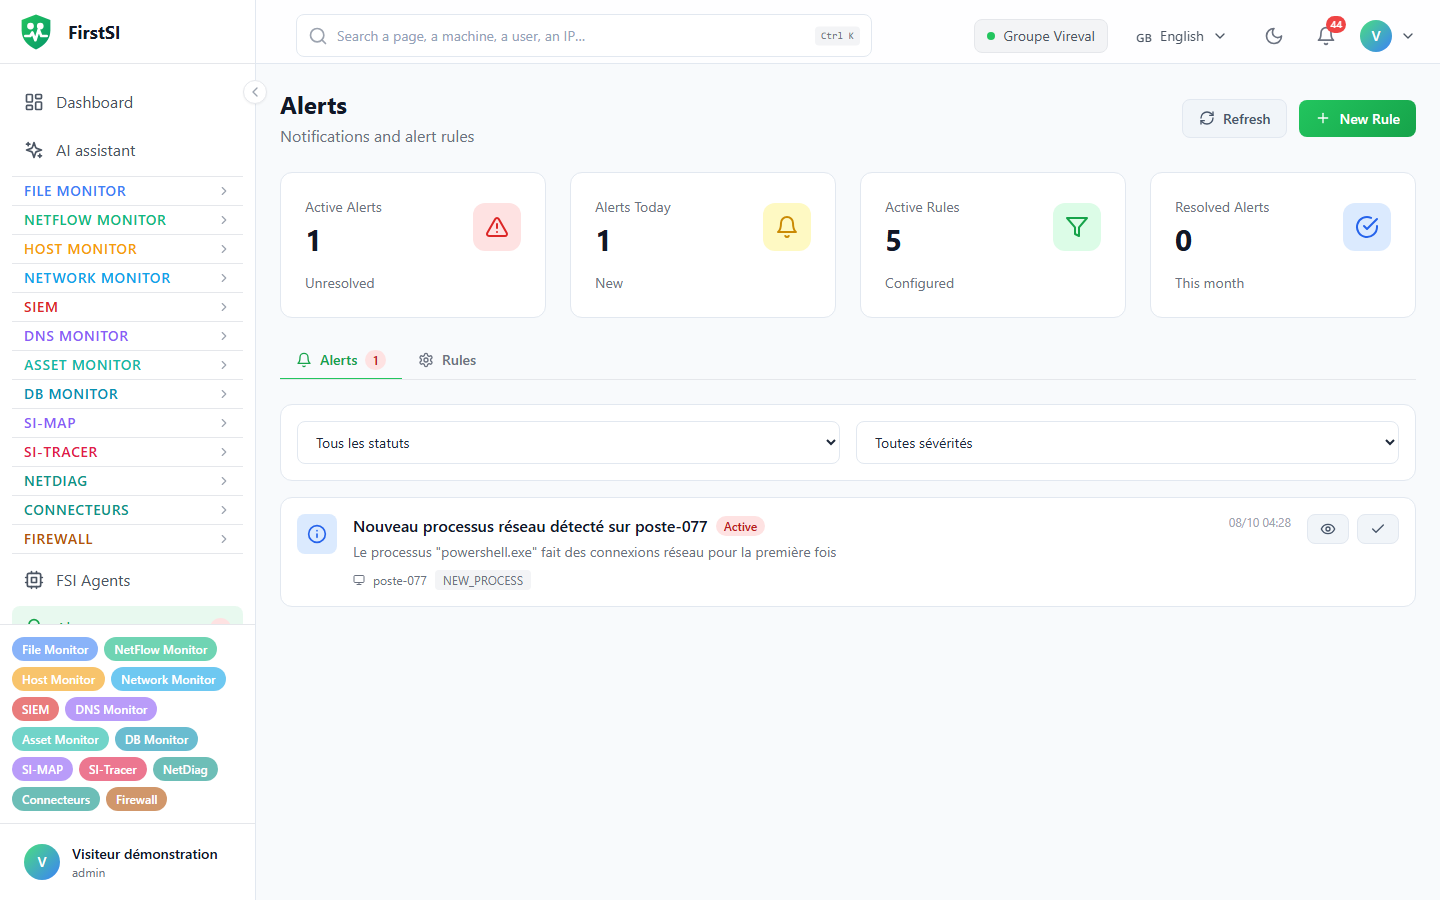
Where alerts end up
| Source | Screen | Docs page |
|---|---|---|
| Network flow rules (volume, port scan, new process, unusual hours…) | Alerts (#/alerts) | below |
| A service or site stops answering | Incidents (#/incidents) | HostMonitor |
| Device offline, tunnel down, latency, packet loss, new or closed port | NetworkMonitor Alerts (#/nm-alerts) | NetworkMonitor |
| Databases (CPU, blocking, PLE…) | DB Alerts (#/dbm/alerts) | DBMonitor |
| New CVEs, end of support, licenses | console notification and AssetMonitor log | AssetMonitor |
| Security correlation (ransomware, password spraying, C2…) | Security incidents (#/siem/incidents) | SIEM |
| A workstation that stays in trouble | NetDiag e-mail or webhook | NetDiag |
| Firewall, threats | Threats tab | Firewalls and gateways |
The Alerts screen
Four cards sit at the top: Active Alerts, Alerts Today, Active Rules and Resolved Alerts. They count every alert in your organisation, not just the ones on screen.
In the Alerts tab you can filter by status (active, acknowledged, resolved) and by severity (critical, warning, information); the list shows the 200 most recent matching alerts. Acknowledge tells the team someone is on it; Resolve closes the alert. The Rules tab is for administrators: create a rule with New Rule, edit it, switch it on or off.
| Rule type | Default setting |
|---|---|
| High traffic volume | 100,000,000 bytes in 60 min |
| Port scan | 20 different ports in 5 min |
| New process | never seen in 7 days of history |
| Unusual hours | 50 flows between 10 pm and 6 am |
| Suspicious destination | 10 connections |
| High frequency | 100 connections per minute |
A new rule starts at Warning severity with a 30-minute repeat delay (1 to 1,440). During that delay, the same rule does not raise another alert.
Real-time notifications
New alerts pop up at the top right of the console, with a beep for critical and high ones. The server does not repeat an identical alert for a while: 1 minute for a critical one, up to 30 minutes for a plain information.
The red number next to Alerts in the menu counts the active alerts of this screen. The bell in the top bar counts everything still waiting on the dashboard, across all modules; clicking it opens the dashboard.
Getting notified outside the console
| Module | Where to set it up |
|---|---|
| HostMonitor | Notifications (#/notifications): e-mail, webhook, Slack, Teams, Discord, Telegram, SMS. Escalation brings in someone else if nobody acknowledges. |
| NetworkMonitor | the e-mail notification on each rule, with an optional reminder, under Alerts → Rules |
| SIEM | SIEM Notifications: severity threshold, event types, channels (the HostMonitor ones) |
| NetDiag | NetDiag settings: 5 e-mail addresses and a Teams or Slack webhook |
| Reports | scheduled e-mail delivery (Reports) |
Cutting the noise
During planned work, set a HostMonitor maintenance window with Suppress alerts, or use Mute Alerts on the NetworkMonitor device concerned. A rule that fires too often is better fixed by raising its threshold or repeat delay than by switching it off, which loses the information. In the SIEM, marking an incident as a false positive when you resolve it helps tune the rule afterwards.
Source: · FirstSI Docs · updated 2026-10-10