Dashboard
Overall IT health, what is still waiting to be handled, and one line per module.
The dashboard is the console's home page. It tells you whether your IT is healthy and what is still waiting for someone.
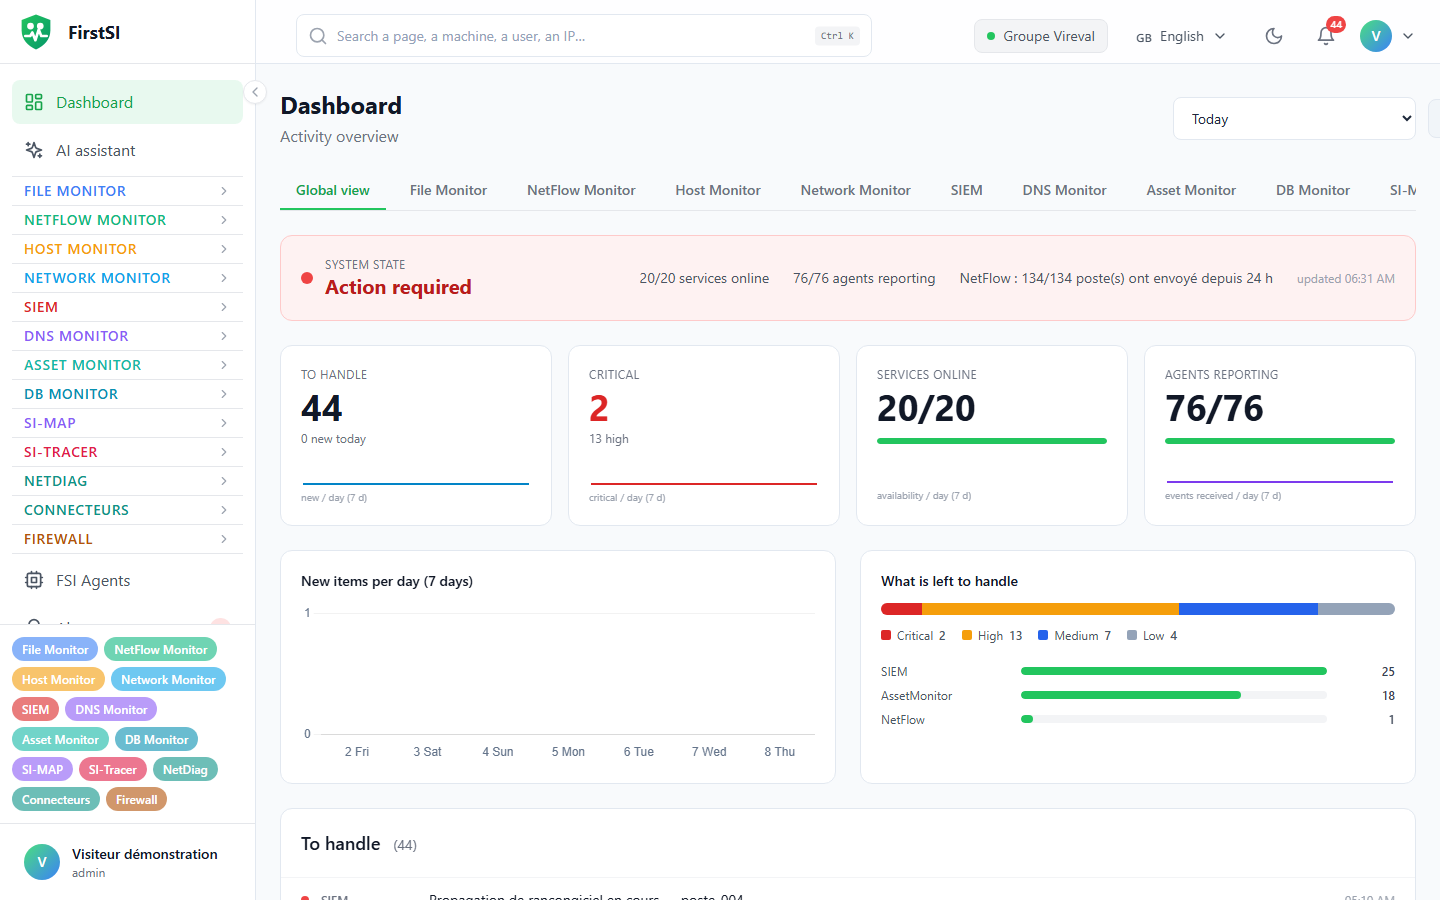
The status banner
| Status | When |
|---|---|
| All good | Nothing to handle, no service down, every agent reporting |
| Needs watching | Something is left to handle, an agent has gone silent or a collection is failing |
| Action required | A service is down, or a critical item is waiting |
An agent counts as silent after 15 minutes without contact.
Tiles and the "To handle" list
The four tiles at the top hold the key figures: To handle, Critical, Services online, Active Agents. Below them, New items per day (7 days) shows the trend and What is left to handle breaks the backlog down by module.
The To handle list ranks open items from most to least severe; click one to open the matching module screen. The Modules list has one line per active module, with its status and its main figure.
Module tabs
When several modules are active, the global view is followed by one tab per module with its own indicators. The period (today, last 7 days, last 30 days) applies to the charts. Refresh reloads the page.
Frequently asked questions
"No file events for more than 24 h". FileMonitor agents have stopped reporting. Start with FSI Agents, then check Windows auditing on the file servers (see FileMonitor).
A module is missing. Either it is not enabled for your organization, or an administrator has not given you access to it.
Source: · FirstSI Docs · updated 2026-10-10