DBMonitor: databases
SQL Server and MariaDB performance, slow queries, sessions, blocking, waits, and business control queries.
DBMonitor collects performance data from your SQL Server and MariaDB instances through an agent. When a database crawls, it tells you who is using it, what is blocking and since when.
Declaring an instance
Install the agent with DBMONITOR=true on a machine that can reach the instance; the database server itself is often the simplest choice. Then, in SQL Instances (#/dbm/instances), click Add Instance and enter the type, the server, the authentication (Windows (service account) or SQL Server (login/password)), the Interval (s) (60 s by default) and the Slow Threshold (2,000 ms by default).
With Windows authentication, the agent connects with its machine's computer account. Give it the right to read the system views (VIEW SERVER STATE) and nothing more.
The screens
| Screen | Question it answers |
|---|---|
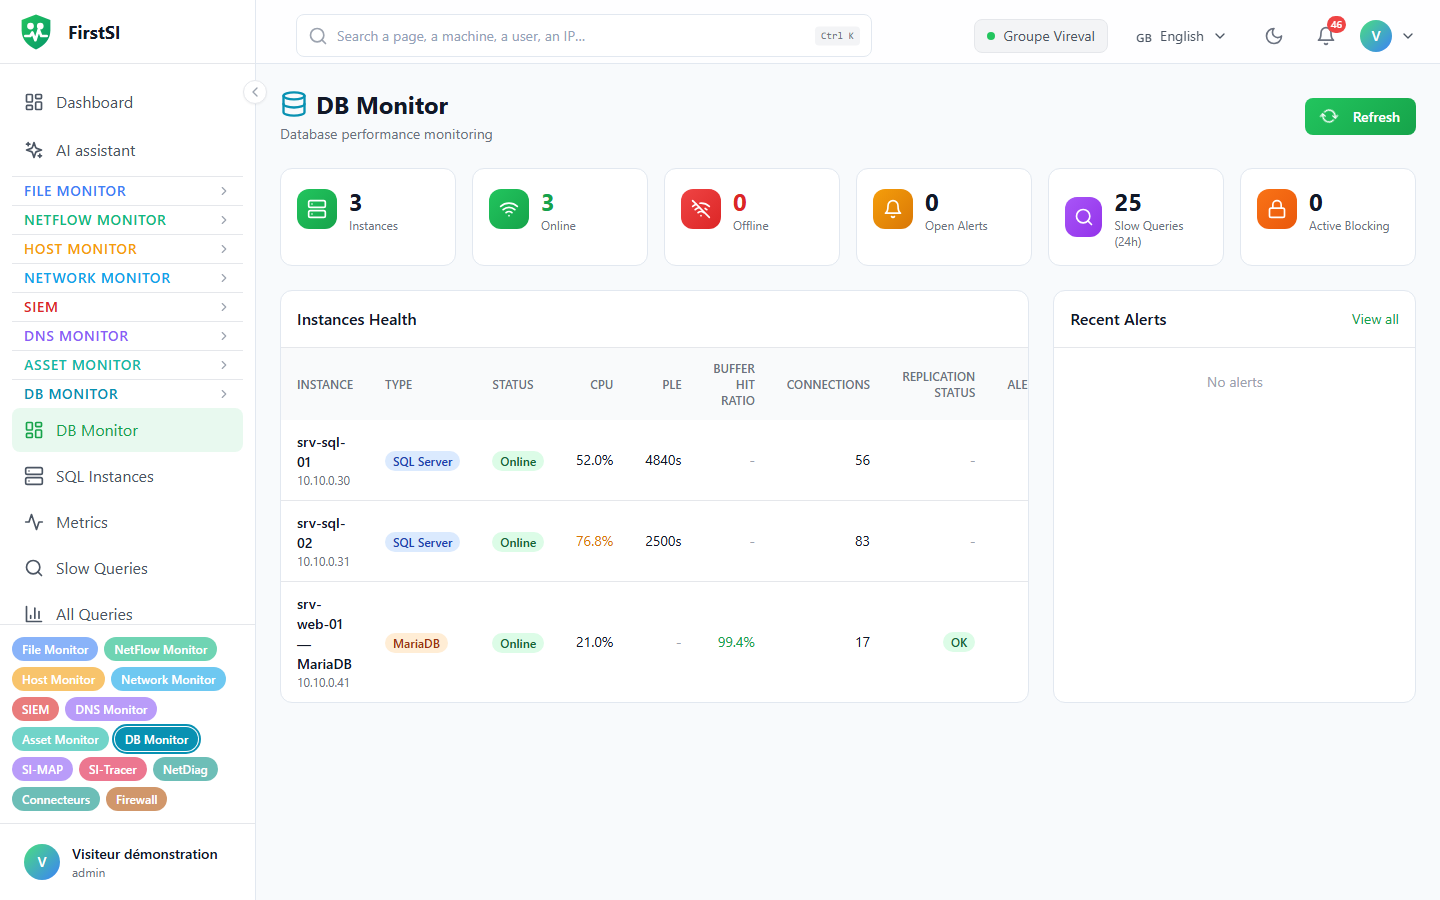
| DB Monitor | Are the instances healthy? Status, CPU and connections of each, with PLE for SQL Server, InnoDB cache hit ratio and replication status for MariaDB; slow queries over 24 h, current blocking |
| Metrics | The instance's CPU, cache, PLE, connections |
| Slow Queries / All Queries | Which queries cost the most (CPU, executions, duration, reads) |
| Sessions | Who is running what: login, host, program; Top logins over 1 h to 30 days |
| Blocking | Who is blocking whom, now and in the history |
| Wait Stats | What the instance is waiting on (disk, locks, memory…) |
| DB Alerts | Thresholds that were crossed, with Acknowledge and Resolve |
Alert thresholds
These are the defaults; each instance can have its own. They are evaluated every minute.
| Measure | Warning | Critical |
|---|---|---|
| CPU | 80% | 95% |
| Cache hit ratio (alert below) | 90% | 80% |
| PLE (alert below) | 300 s | 60 s |
| Deadlocks | 1 | 5 |
| Active connections | 200 | 400 |
| Blocking duration | 30 s | 120 s |
Control queries
A control query checks a business rule: "was there a full backup in the last 26 hours?", "are rows still waiting to be imported?".
In Control queries, click New check. The query must be a single SELECT (or WITH … SELECT); writes, procedure calls, SELECT INTO and multiple statements are refused. Then choose what you expect: no rows, at least one row, a value below a threshold or a value within a range. Default frequency 5 min (1 min to 24 h), 15 s timeout at most, 1,000 rows at most, severity from LOW to CRITICAL.
Try it runs it straight away. Only the outcome of the evaluation is stored, never the rows read. A failing check switches to Alerting on its screen; a linked HostMonitor maintenance window silences it.
Rights
Every role can view, viewers included. Acknowledging and resolving an alert requires the operator role. Creating or deleting instances and checks is for administrators, or for someone who has been delegated that right.
Frequently asked questions
The "Who" column says "not observed". No session sample matches that query over the period: either it ran too briefly to be seen, or the agent is out of date.
My control query is refused. It contains a write, a procedure call or several statements.
Source: · FirstSI Docs · updated 2026-10-10