HostMonitor: service availability
Monitor websites, ports, certificates, databases, Windows services and folders; incidents, maintenance, escalation and status page.
HostMonitor checks at regular intervals that a service answers. When it stops answering, it opens an incident and notifies the people you chose. It can also publish a status page.
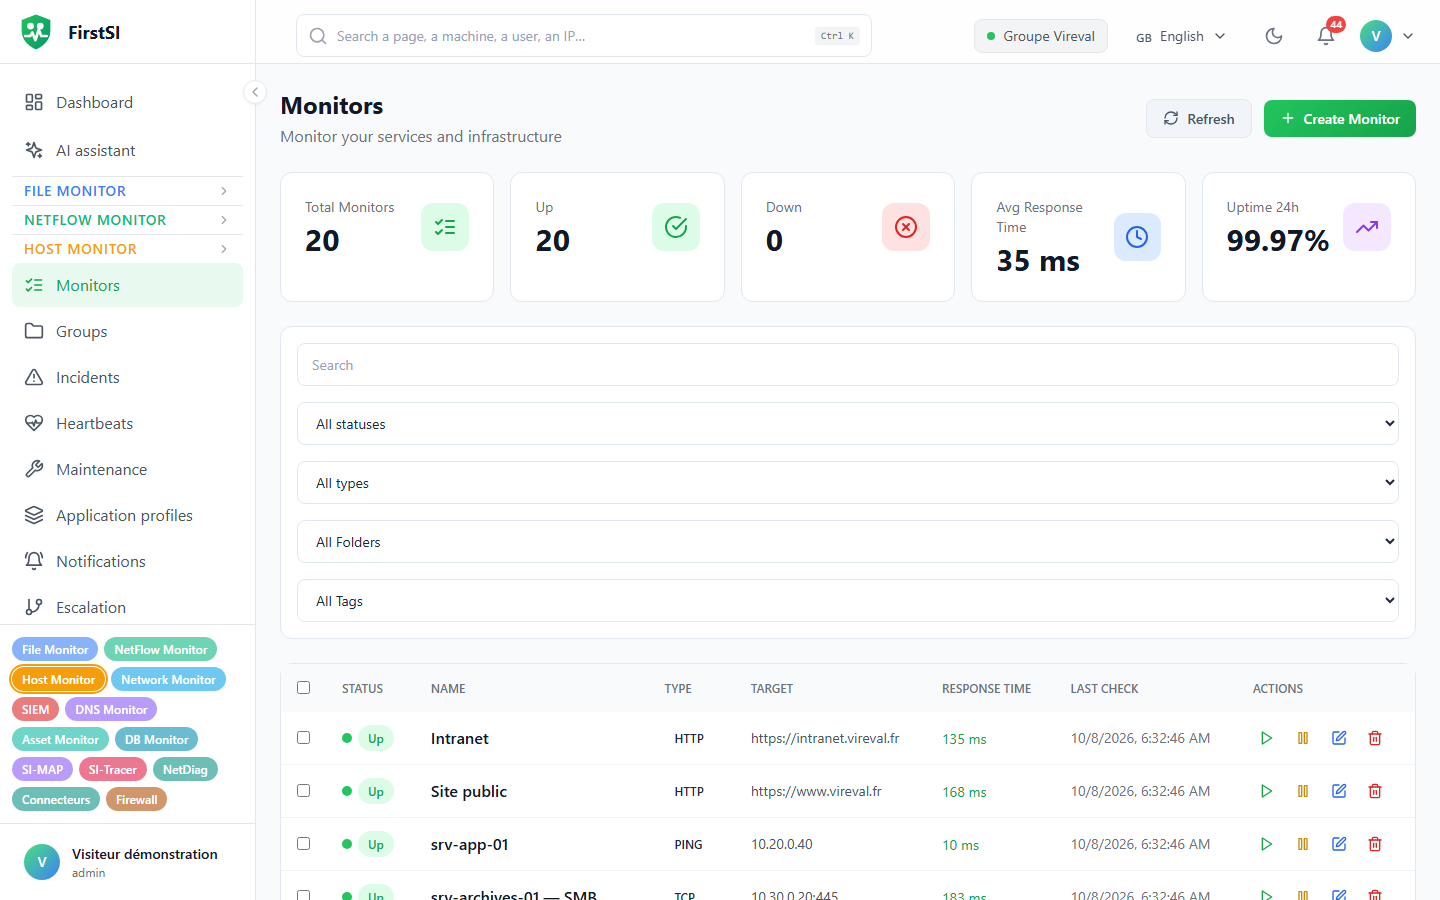
Creating a monitor
In Monitors (#/monitors), click Create Monitor and pick the type:
| Type | What is checked |
|---|---|
| HTTP/HTTPS, Keyword | Response code, response time, presence of a piece of text in the page |
| SSL Certificate, WHOIS | Expiry date of the certificate or the domain name |
| Ping, TCP Port, DNS | Network response, open port, resolution |
| MySQL, PostgreSQL, SQL Server, Redis, MongoDB, Docker | Connection to the service |
| Windows service | The service is running on the machine (through an agent) |
| File state | Age of the newest file, growth, number of files and expected extensions in a folder (through an agent) |
| Setting | Default |
|---|---|
| Interval | 60 s (30 s to 24 h) |
| Response timeout | 30 s |
| Alert after N failures / Recovery after N successes | 2 / 2 |
From the server or from an agent
A check run by The FirstSI server starts from the server, the way an outside visitor would. A check run by A machine's agent starts from your network; the available types are then HTTP, TCP, Ping, Windows service and File state. The last two only work through an agent.
Reading the status
A monitor goes Offline after the configured number of consecutive failures and comes back Online after the configured number of successes. A certificate or domain name turns Degraded 30 days before expiry, then critical at 7 days.
A monitor's page shows the response time, the latest checks and the incident history, with Test now, Pause and Resume buttons.
If a probe run by an agent stops returning results for 3 intervals, it counts as failed, with a message making clear that the agent is not answering, not the service. A monitor attached to a parent stays quiet while the parent is offline: when a whole site goes down, you get one alert instead of fifty.
Handling an incident
In Incidents (#/incidents), Acknowledge tells the team someone is on it; Resolve closes it, with the Root Cause and Resolution Notes. The counters at the top show open incidents, incidents resolved in 24 h and the mean time to resolution (MTTR).
Notifying and escalating
Notifications manages the channels: e-mail, webhook, Slack, Teams, Discord, Telegram, SMS, each with a Test button. Escalation chains steps, for example "after 15 minutes without acknowledgement, call the on-call person", with a delay and a repeat. HM Settings holds an SMTP server specific to the module, Quiet Hours, and export or import of monitors (JSON, CSV).
Maintenance
Maintenance → Schedule maintenance creates a one-off or recurring window on the monitors you choose. Tick Suppress alerts so nobody is notified during the work.
Scheduled jobs (heartbeats)
Heartbeats watches a job that must check in regularly: backup, overnight script… Each heartbeat has a Ping URL that the job calls when it finishes:
Invoke-RestMethod -Uri "https://console.example.com/api/heartbeat/<identifier>/ping" -Method PostIf the ping does not arrive in time, an incident opens.
Status page
Status Page → Create Page: address /status/<name>, colours, logo, monitors shown. The Public page (accessible without authentication) option makes it readable without signing in. It shows availability over 90 days and, if you wish, recent incidents.
Application profiles
An application profile groups an application's probes, control queries and maintenance windows. You can Deploy it in one go to another server, then Compare to spot differences (matches, changed, missing…).
Rights
| Action | Roles |
|---|---|
| View | viewer, operator, administrator |
| Pause, test, acknowledge, resolve, create a maintenance window | operator, administrator |
| Create, edit, delete; status pages; settings | administrator |
Source: · FirstSI Docs · updated 2026-10-10