Flow explorer
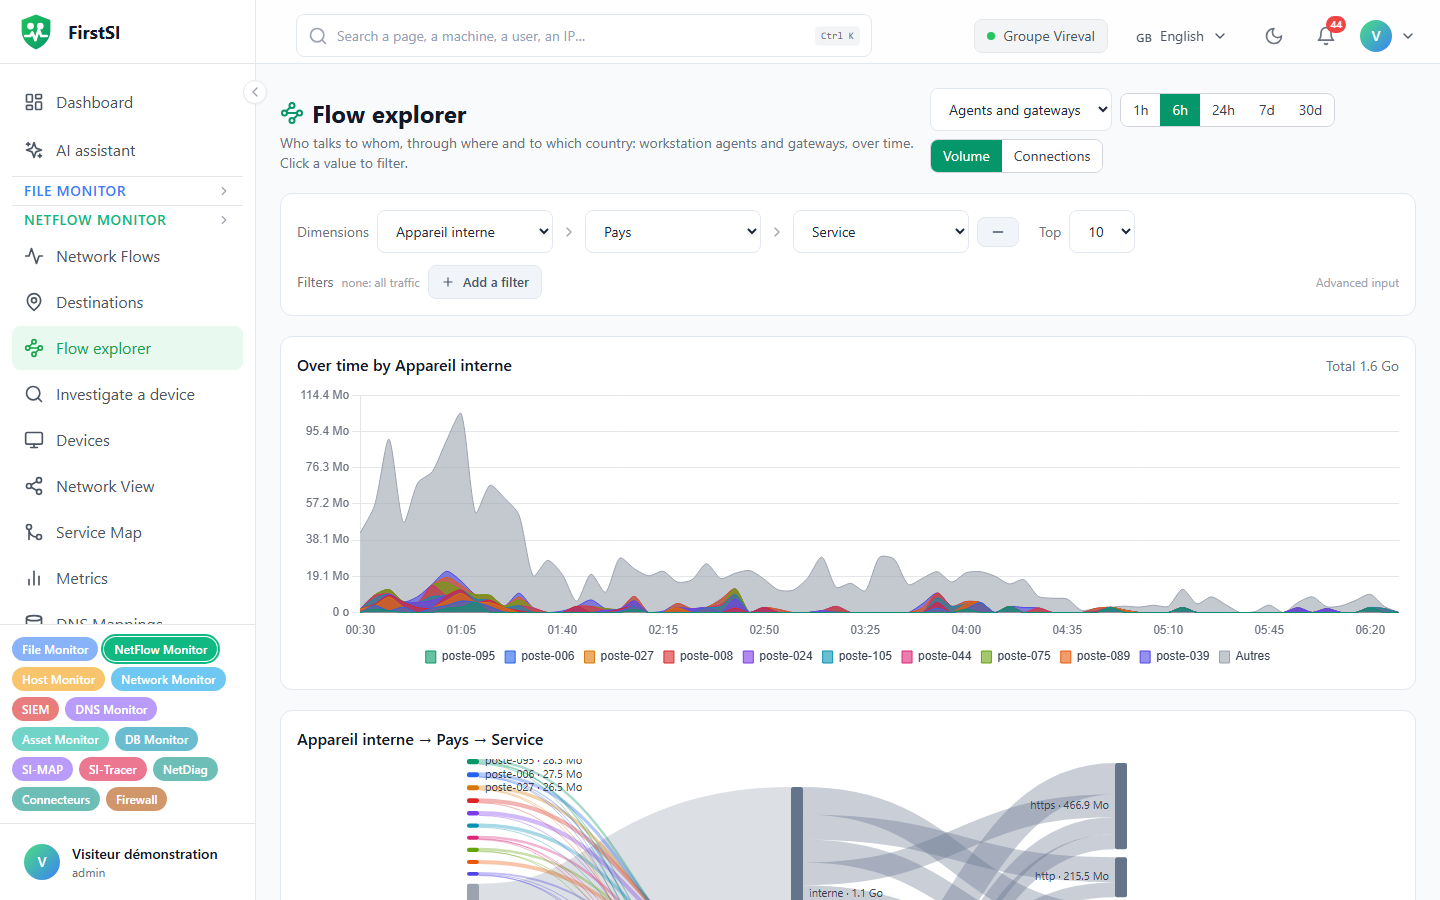
Slice flows from workstations, gateways and the firewall by country, service, process… with a chart, a Sankey diagram and filters.
The explorer is built for questions like "which countries receive the most data from head office this week?" or "which process is sending to this service?".
Building a view
First pick the source: Agents and gateways, Workstation agents, Gateways (IPFIX) or Firewall logs. Then the period (1 h, 6 h, 24 h, 7 days, 30 days) and the measure, volume or connections; the firewall only provides connections.
Then add up to three Dimensions among internal device, external address, country, operator (AS), port, service, domain, process, user, gateway, interface, action… The Top setting sets how many values are kept per dimension, from 5 to 20.
The result comes in three forms: a trend chart, a Sankey diagram and a table with a Share column.
Filtering
Add a filter asks for a field, a condition (is, is not, contains, is one of…) and a value, with an Exclude checkbox and an AND / OR choice between filters. Advanced input shows the filter as text, handy for copying it or adjusting it.
The quickest way is often to click a value in the table or the Sankey diagram: it becomes a filter. The magnifier next to a device opens Investigate a device.
Limits
Beyond 6 hours, the explorer reads hourly totals and some dimension combinations are no longer offered. Beyond 400,000 rows read, a "result truncated" notice appears: narrow the period or add a filter. If Gateways (IPFIX) is greyed out, no gateway is sending flows; see Firewalls and gateways.
Source: · FirstSI Docs · updated 2026-10-10